101 Shopifys
Introduction
We collected a list of the most famous and visited Shopify e-commerces, and we tried to understand what makes them special.
CrUX Data
CrUX provides important web metrics, aggregated by domain and device. This data is collected in a 28-day window, guaranteeing high confidence in the values.
Best in Class
From the 101 shops, we extracted the most visited ones, based on the Cloudflare domain ranking, considering only the shops that are among the top 100,000 most visited websites on the Internet.
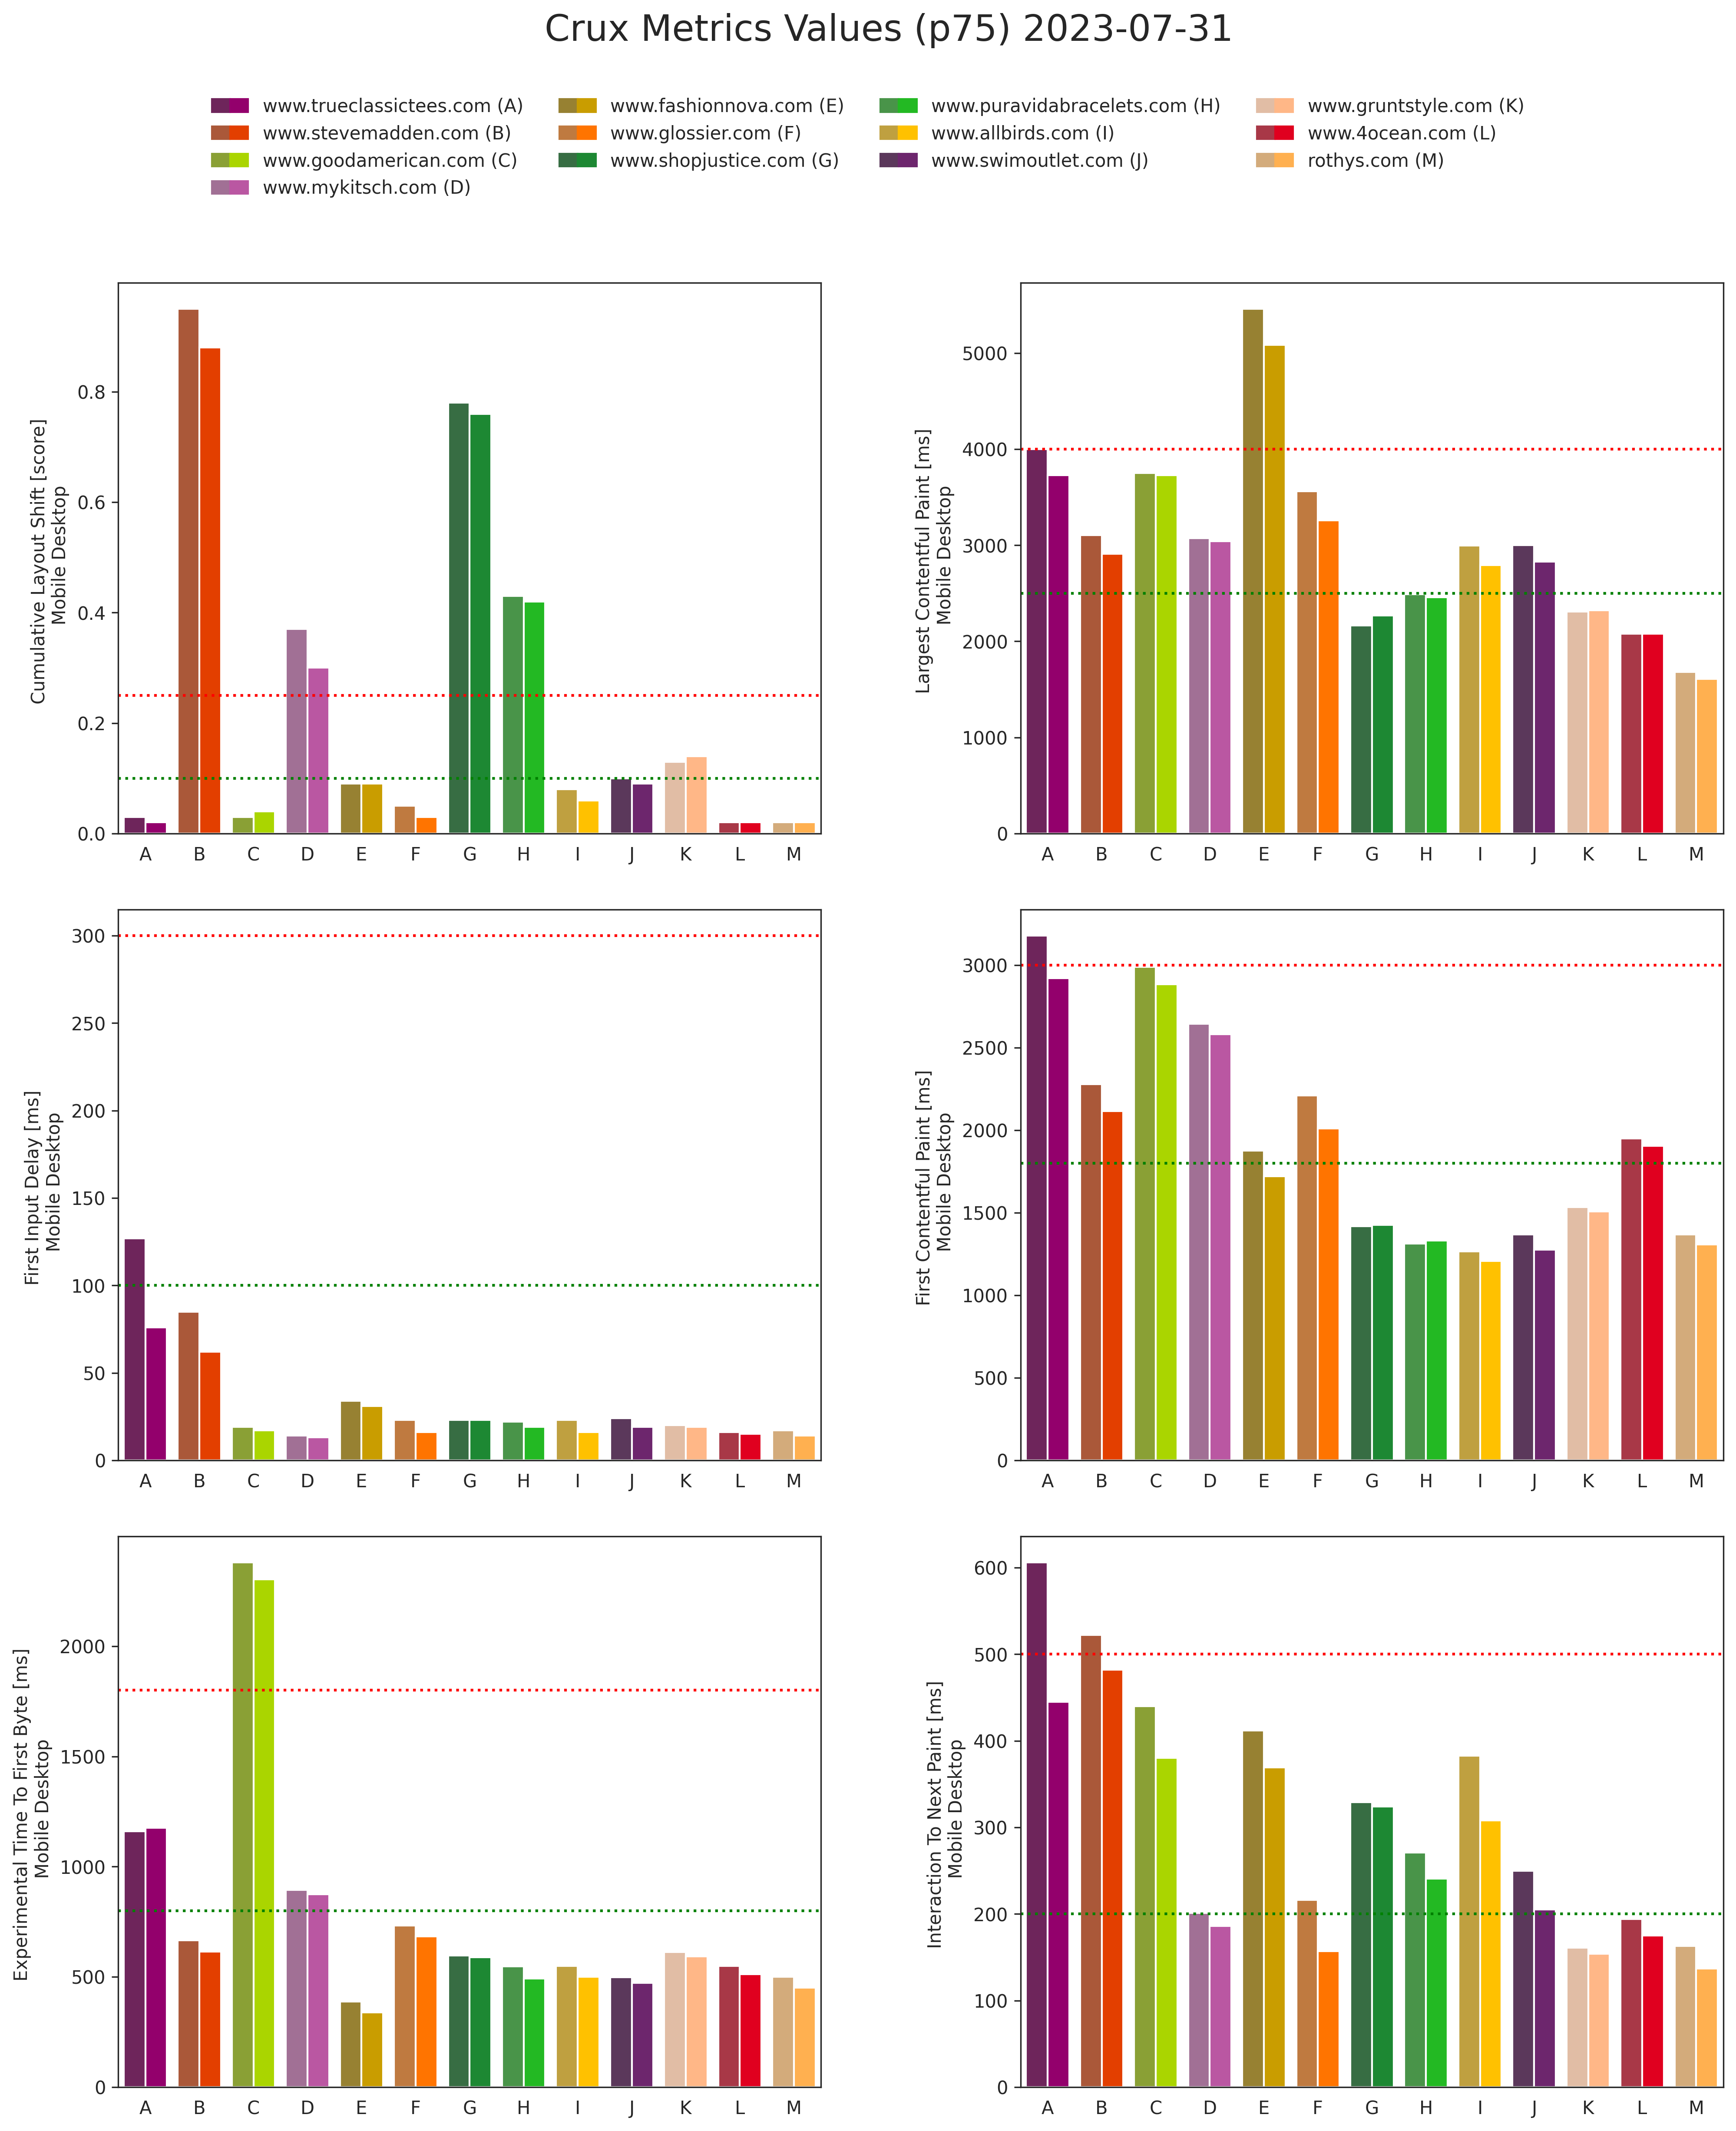
CrUX Absolute Values
With its values, CrUX also provides a range where the values should stay to be considered good, normal, or bad. In the following plot, values below the green bar are considered good, and values over the red bar are considered bad.
Furthermore, the bar is split between mobile (left) and desktop (right).
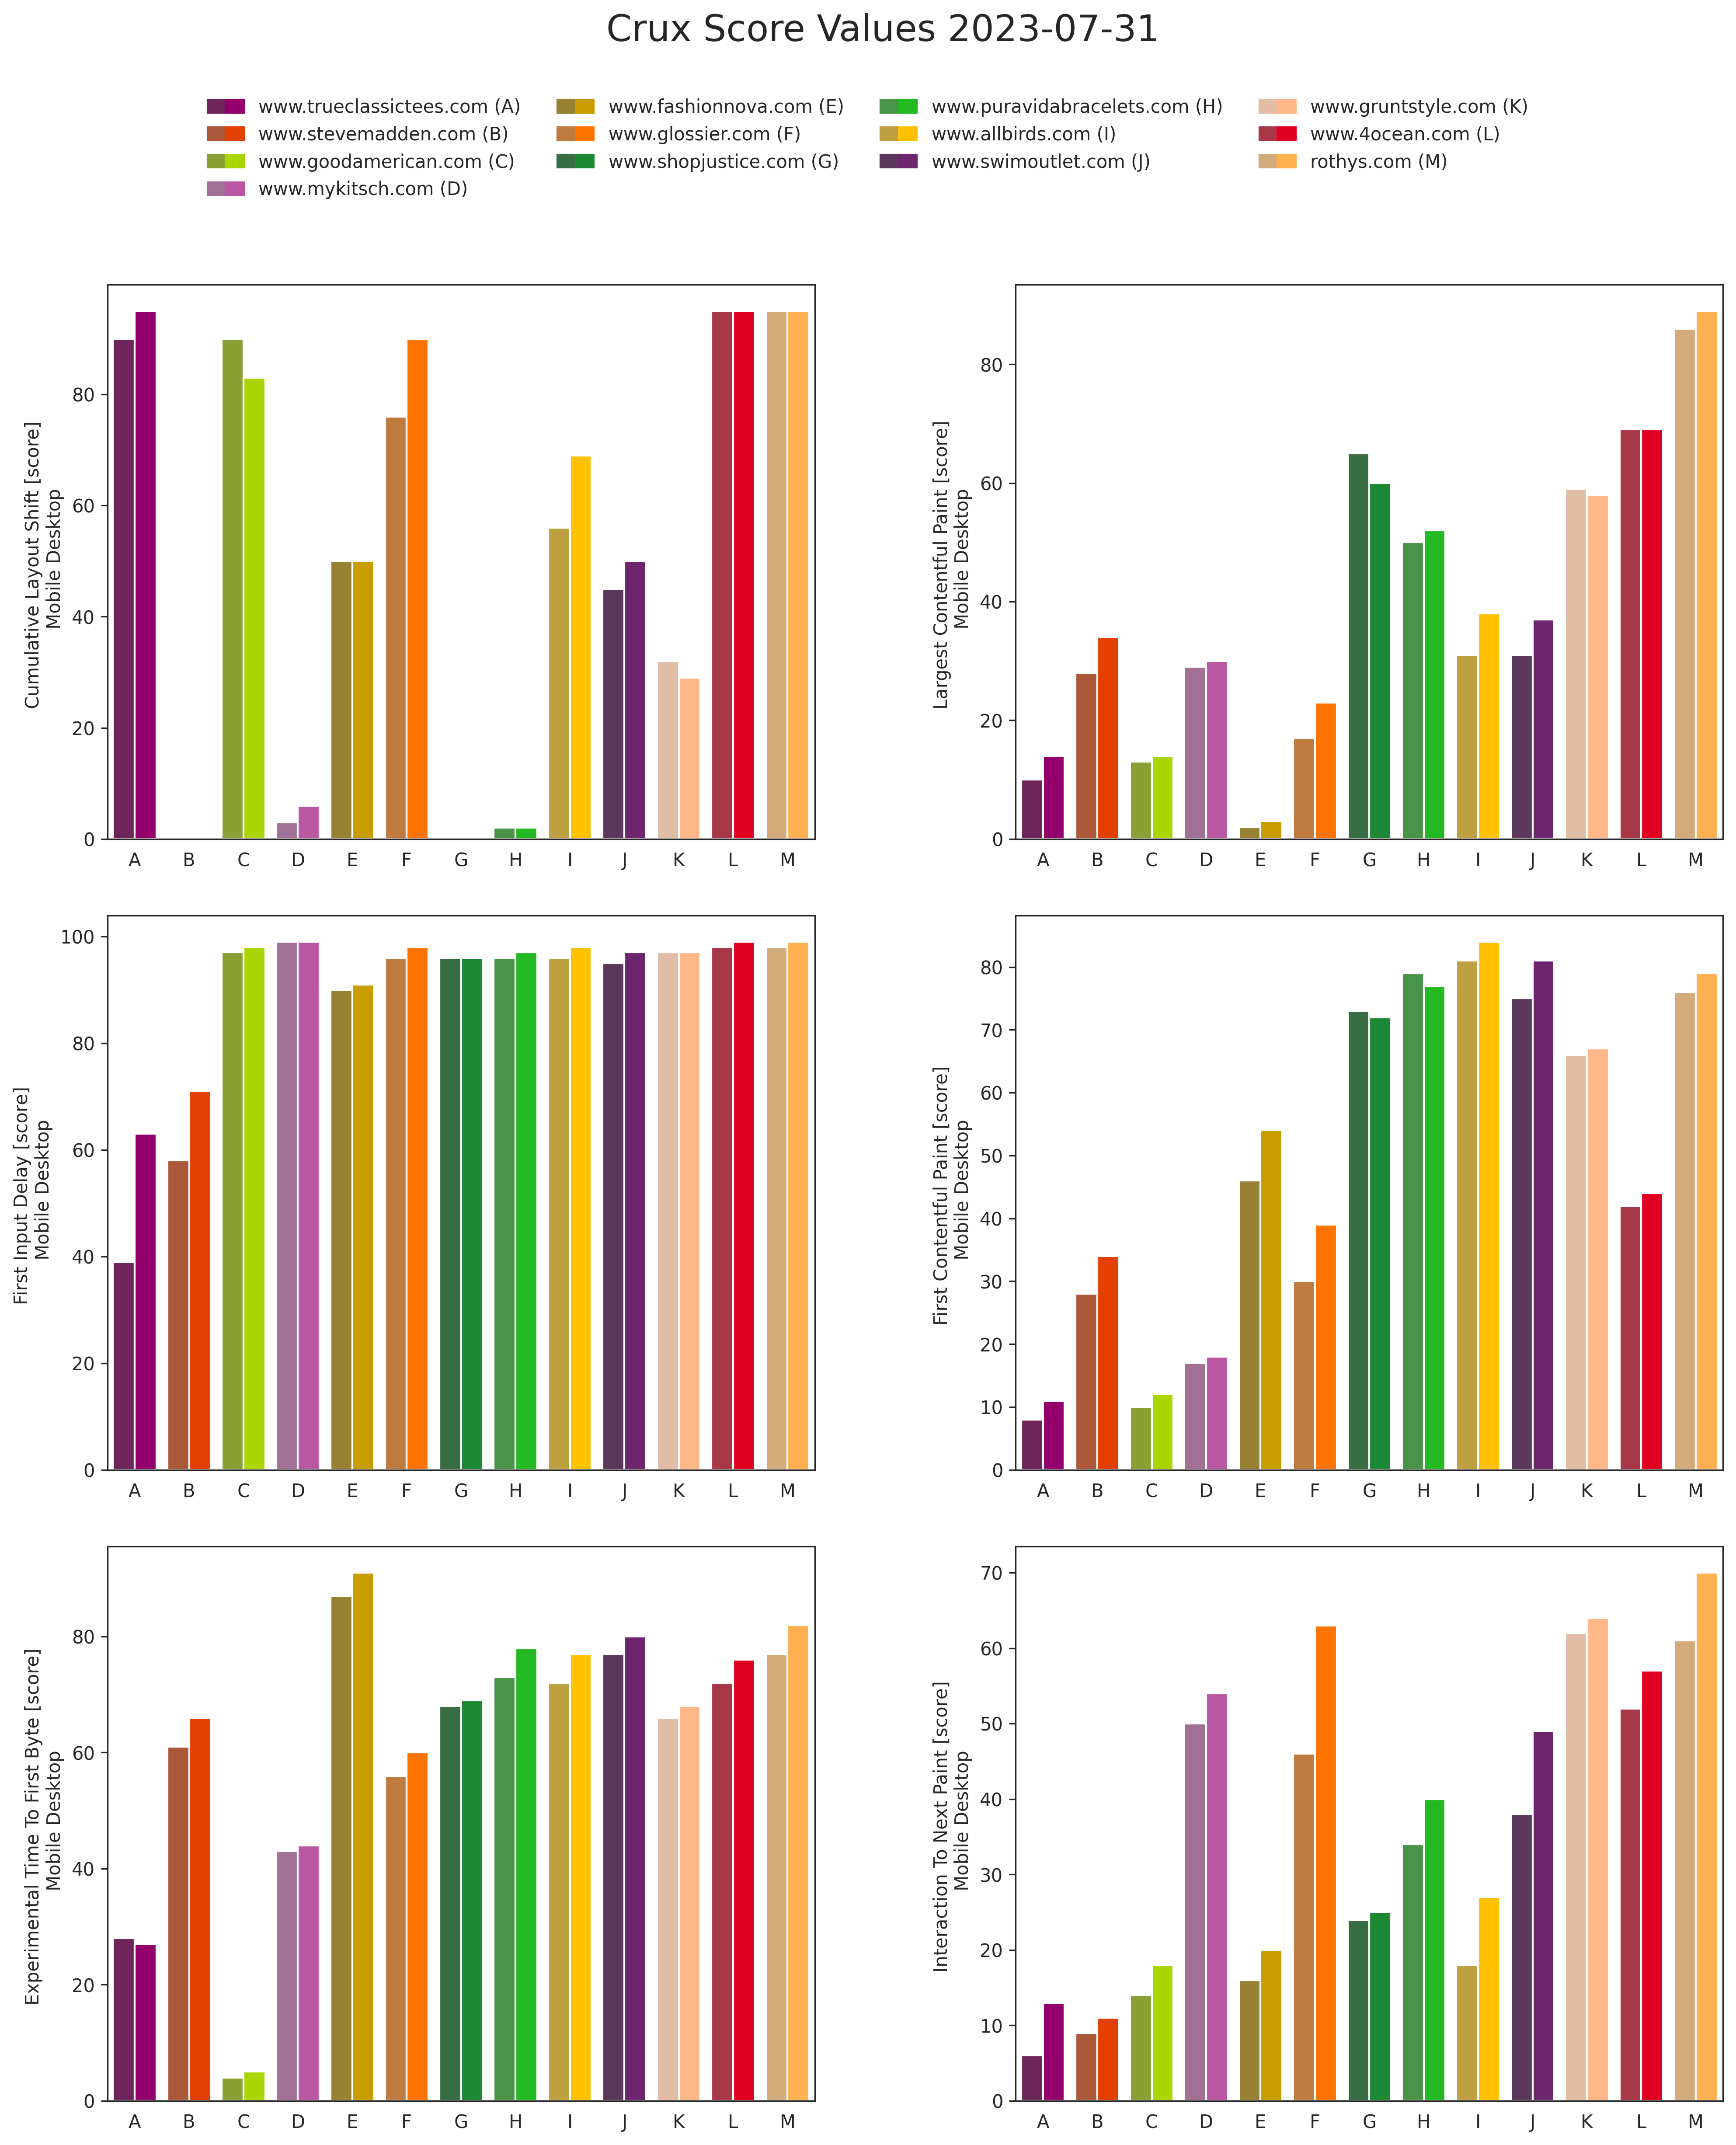
CrUX Scores
Using the same thresholds, we have calculated a score for each metric, applying the same formula used by Lighthouse.
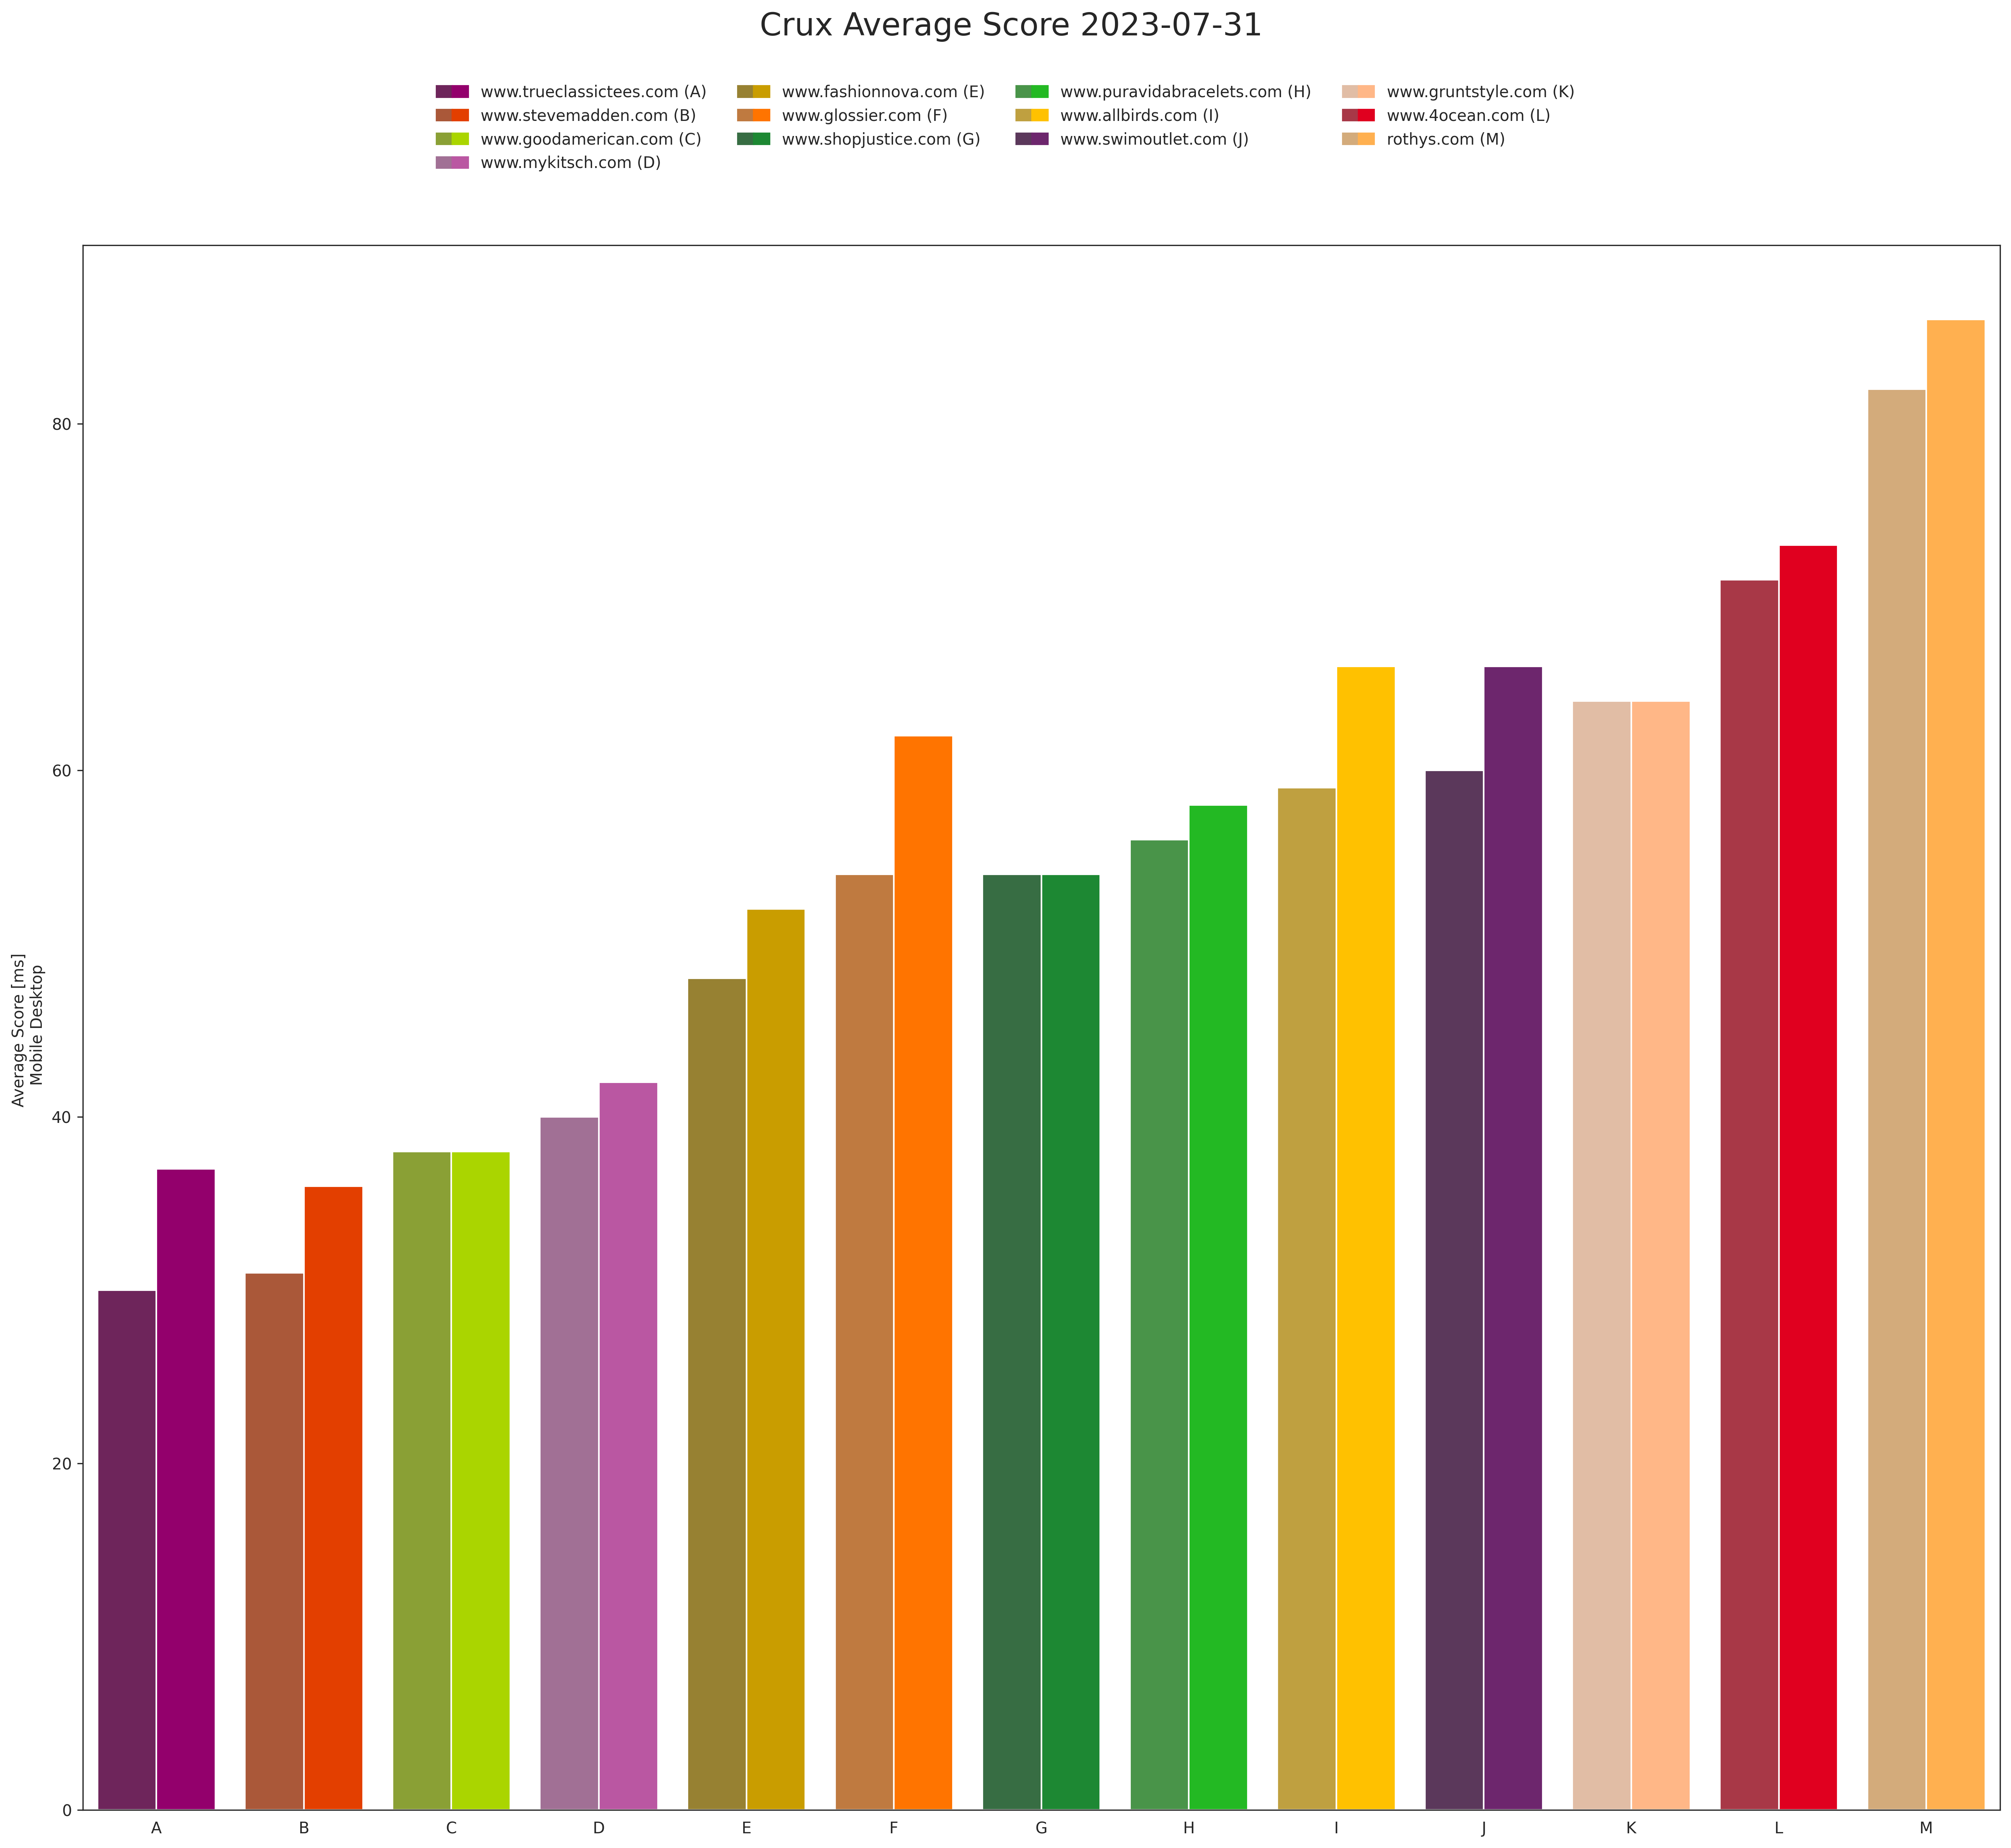
CrUX Score Average
Since CrUX doesn’t provide all the metrics needed to calculate the Lighthouse score, we have simply taken an average of the previous scores, resulting in an overall score.
Page Speed Insights Data
Page Speed Insights performs a Lighthouse analysis on the given URL. While it would be difficult to collect statistically valid numbers, from that dataset, we can extract valuable statistics from the analysis. In particular:
- Dom-elements: the total number of elements in the DOM
- Total requests: the total number of network requests
- Total transfer size: the total sum of data downloaded
- Scripts requests: The total number of requests that are scripts
- Image requests: The total number of requests that are images
- Third-party requests: The total number of requests that are on external domains
We then analyzed 101 home pages, and these are the results:
Page Speed Insights Mobile
Click on the image to enlarge
Page Speed Insights Entities
When PSI collects data, it also gathers information about all the technologies it can recognize, allowing us to determine which ones are the most commonly used. We have integrated that data with Cloudflare’s URL Scanner.
Most Used Technologies
We have aggregated data from approximately 101 home pages, 101 product pages, and 101 collection pages, and then further aggregated the data per website.
Correlation Between Technologies and Score
With all the data we have collected, we aim to explore whether any technology has an impact on the statistics provided by PSI. While we haven’t observed any correlation between score metrics and technologies, we did find that the some statistics can be significantly influenced.
Here is the mandatory correlation is not causation warning.
Conclusion
We had a great time collecting all these numbers, and we plan to repeat the process occasionally to track how the websites change over time.